
Kansas City, Mo. residents were recently given the opportunity to give input on COVID-19 and the effectiveness of city operations.
Bo McCall, a Performance Analyst with DataKC in the City Manager’s Office, gave the City Council an overview of the recent COVID-19 Resident Survey conducted in July and the quarterly Resident Survey at the council’s business session on Thursday, Sept. 24.
Conducted by DataKC in partnership with ETC Institute, the COVID-19 survey was completed by a random sample of 302 residents. There are currently no plans or funding allocated to repeat this survey which focuses on resident perceptions of COVID-19, perceptions of City leadership and communications, and resident actions in response to the pandemic.
Of the residents surveyed, 49% know someone who has tested positive for COVID-19, which was up considerably from the previous survey. This number differs by the race of the respondent, with 70% of Latinos and Hispanics responding yes, 51% of Black residents, 46% of white residents and 56% of residents of other races.
Nearly 78% of residents believe COVID-19 is a real threat to their community, while 18% say it is not, which is up from 11% in June.
Ratings of city leadership have declined since June, but four out of five residents surveyed support the Executive Order that requires face masks to be worn in public places.
Although 20% don’t support the mask order, support is higher among residents with an income of less than $30,000 at 87%, with an income of $30-50,000 at 85%, Black residents at 85% and residents aged 65 or older at 87%.
Both Black and elderly populations are more likely to be affected, as are those with an income more likely to be working a service job.
The opposition is higher among residents with an income of $60-99,000 at 29% and with an income higher than $100,000 at 25%, white residents at 24%, residents aged 18-34 at 25% and aged 55-64 at 24%.
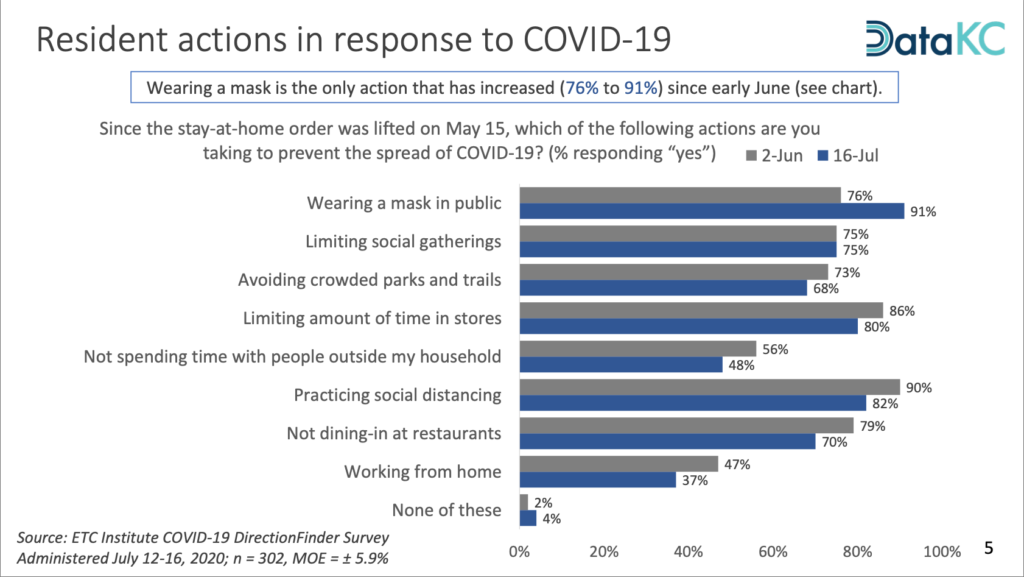
Respondents were surveyed on their actions since the stay-at-home order was lifted on May 15, including wearing a mask in public, limiting social gatherings, avoiding crowded parks and trails, limiting the amount of time in stores, not spending time with people outside their households, practicing social distancing, not dining in at restaurants and working from home.
Wearing a mask is the only action that has increased since early June, growing from 76% to 91%. While limiting social gatherings remained steady at 75%, all other safety measures have fallen between 5-10%.
When asked if they think local officials are keeping them informed, 69% agreed, a drop since April at 77% and 73% in June.
Black and Hispanic residents are more likely to agree that efforts to inform are good at 74% for both groups, as well as 75% of residents aged 18-34 and over 65, 76% of residents aged 45-54, and residents with an income of less than $100,000 at 74%.
Residents aged 55-64 and residents with an income of $60-99,000 are more likely to disagree that efforts to inform the public are good.
Residents have continued to differentiate between levels of government in their satisfaction with the pandemic response, but ratings have declined for all levels since June. In mid-July, 19% surveyed were satisfied with the response from the federal government, down from 47% in March. On the state level, 21% were satisfied, down from 43% in March. Although the county satisfaction rate rose in April and June, it is down to 35% in July. Satisfaction with the city’s response started at 58% in March, rose to 69% in April and 68% in June, and fell to 55% in July.
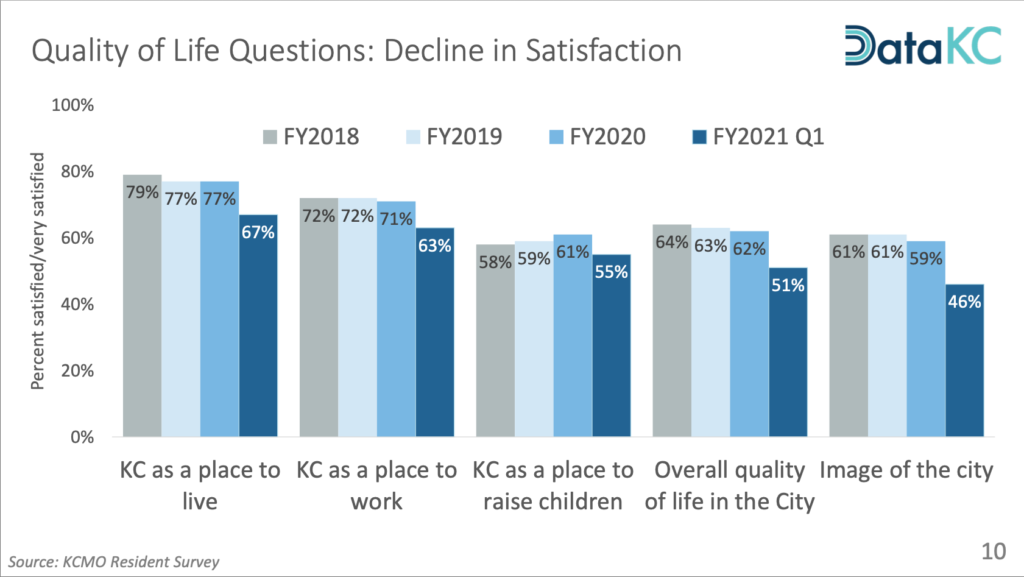
The first quarter resident survey for fiscal year 2021 was conducted in August 2020 with additional questions added about economic development, police, communications, and connectedness. The survey found that fourth-quarter increases in satisfaction were not sustained, and some service areas saw declines. Based on the results, residents have experienced a major decline in quality of life over this quarter. Overall, there were few increases in satisfaction.
Residents’ priorities remain unchanged with infrastructure, meaning streets and sidewalks, police services and neighborhood services in the top three. Health Department services rose from 14th place to 4th in FY 21 quarter one, and public transportation and communication rose, as well.
New this year, questions on economic development surveyed the city’s use of incentives to support economic opportunities for residents. With 21% satisfied and 38% dissatisfied overall, the highest rates of dissatisfaction came from 4th District residents at 45% and Hispanic residents at 48%.
Of the 20% of residents who own a small business or are self-employed, 40% are dissatisfied with support for entrepreneurs and small business owners. This is compared to a split 30% satisfied and 30% dissatisfied with respondents overall.
When polled on the ability to obtain training opportunities to advance one’s career, 38% were satisfied and 20% were dissatisfied. For residents with an income lower than $30,000, Black and Hispanic residents, or residents of the 5th District, a 24-26% dissatisfaction rate in each of these groups showed areas calling for improvement.
When searching for job opportunities within the city limits, 25-28% of residents in the 3rd, 4th and 5th Districts, 27% of Black residents and 31% of residents earning less than $30,000 were dissatisfied.
Concerning relationships between neighborhoods and police, the citywide satisfaction rate is 59%. In Council District 1, satisfaction rates are high at 83%. District 2 has 66% satisfaction and 11% dissatisfaction. District 3 drops to 47% satisfaction and 23% dissatisfaction. District 4 has a 56% satisfaction rating with 17% of residents dissatisfied. District 5 had the highest rate of neutral respondents at 33%, but had a satisfaction rate of 41% and the highest dissatisfaction rate at 26%. District 6 residents are 57% satisfied and 14% dissatisfied.
Citywide, 26% of residents were dissatisfied with the responsiveness of the police department. Those feelings were most present from Black residents at 39% and lower-income residents, with dissatisfaction rates between 27 and 29% for those making less than $59,000. White residents and those making more than $100,000 were most satisfied, polling between 51 and 52%.
The presentation material from the September 24 Business Session is available on the City’s website. The results of the Resident Survey can be found here.


Comments are closed.